October - 2021
NOTE: you might want to download the code again as I have made lots of changes to it!
When I found out that there was a website on the Internet that tracked earthquakes all over the world in near real time
https://www.seismicportal.eu/fdsnws/event/1/query?limit=1&format=json
and made the data freely available I knew I had to build a device to display it. I first built a prototype using ESP32Forth and a 3.5" display but I wanted a larger display to make viewing the earthquakes easier especially from a distance. I then bought a nice 7" SPI display to use with the ESP32 but I quickly ran into memory issues that made me re-evaluate the use of an ESP32 for this project. I then looked through my electronics stash and dug out a Raspberry Pi Model 3B and the official touchscreen display and thought this would be a better platform to use for this project. I began porting my Forth code to C++ for the Raspberry Pi but quickly decided Python would be a better choice. What took me about 3 weeks of Forth programming to accomplish took me a day and a half to reproduce in Python on the Raspberry Pi even though I am not an accomplished Python programmer.
Once the program was running I then looked around on the Internet for a case to hold the hardware and found what I thought would be perfect. The case I used is available here. Unfortunately it didn't work out perfectly but turned out OK. In total it took about 10 hours of print time on my Prusa printer.
I had quite a bit to learn about how to accurately plot longitude and latitude on a map for the display. I initially tried to use a Mercator projection of the Earth but this entailed the use of calculus to do the plotting so I abandoned that approach. Further research turned up the equirectangular Earth map projection with its much simpler plotting equations which I subsequently used.
I made extensive use of the Pygame library for doing the display of the map and for drawing the circles which indicate the earthquake sites. Freetype was used for rendering text. The Python code for this project is available here.
By watching this device during its development I discovered there can be hundreds of earthquakes that happen around the world in every 24 hour period. One can easily see where the Earth is undergoing tectonic stresses like around the Pacific Ocean's ring of fire as there are always lots of earthquake happening there. It is also obvious that Africa is slamming into Europe (causing the Alps to grow) because there are lots of earthquakes in the Mediterranean region daily. I was watching this device on the 29th of September and I noticed that Hawaii was being hit with earthquakes over and over. I saw at least ten in an hour period and that they were occurring very close to the surface. This made me wonder what was going on there. When I read the paper the next day I saw that the Kilauea volcano had just erupted. The swarm of earthquakes was a precursor to the eruption.
One other unanticipated benefit of watching this device operate is that I am becoming familiar with many regions around the world that I was unaware of. Watching where the earthquakes occur is like a world wide geography lesson.
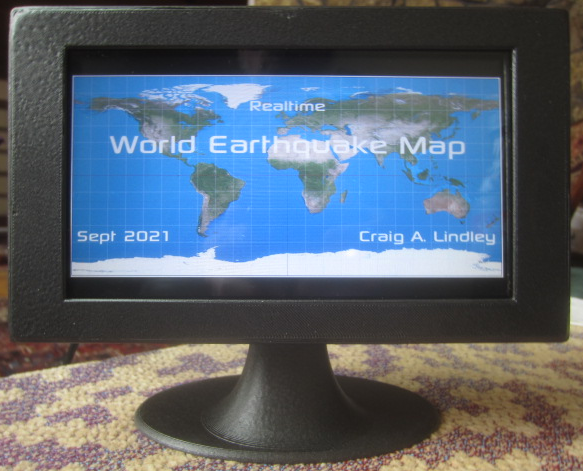 |
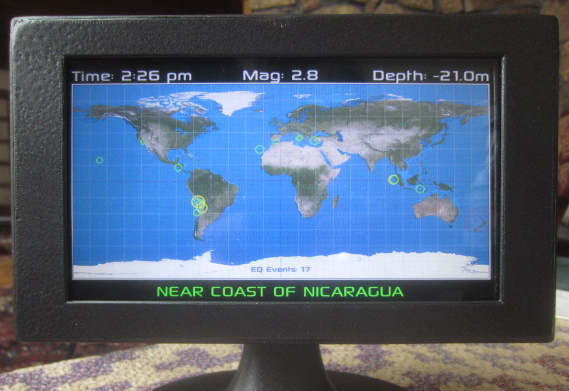
Front
view of the finished unit in its 3D printed case
displaying the title screen.
To save energy when no one is watching the display automatically turns off after 10 PM and stays off until after 7 AM the next morning. Earthquake data is recorded over a 24 hour period. The quake data is cleared at 10 PM when the display goes off for the evening. The number of quakes shown on the display are those that have occurred since 10 PM the previous evening. |
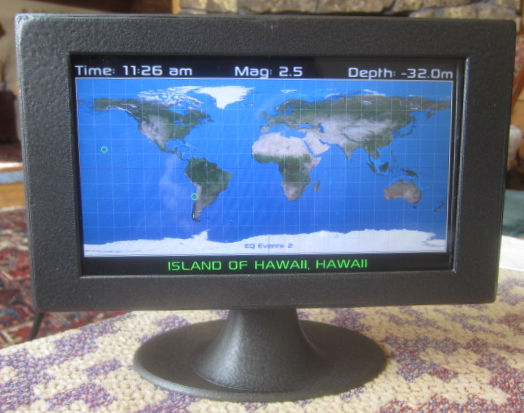 |
Earthquakes are displayed using circles the size and color of which are determined by the magnitude (Mag) of the quake. The most recent quake is displayed with a flashing circle over the location and the data for that quake is shown surrounding the map on the screen. The time of the current quake is shown in local time using 12 hour display format. A database of recent quakes is maintained and displayed on the screen. The count of earthquake events in the database is shown in the lower, center of the display. The color of the location text indicates the magnitude of the quake. Mag 1 - 3: green; Mag 4-6: yellow and Mag 7-9: red. |
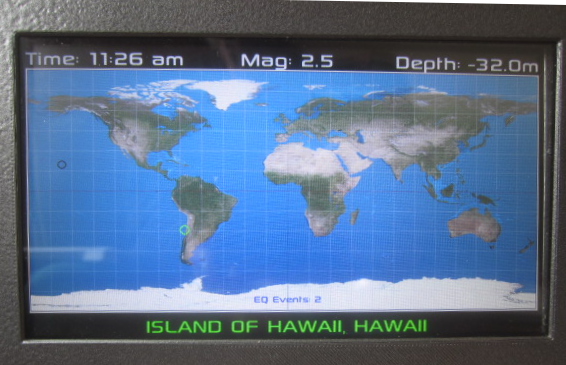 |
Close up view of the display. This is the equirectangular Earth map projection and it spans the whole width of the display (800x480). Depth is in miles below the surface. |
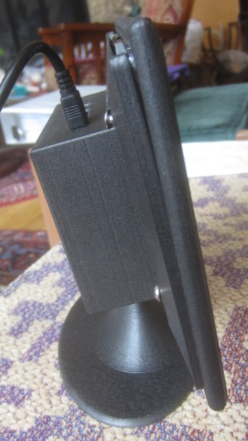 |
Side view of the finished unit with its
3D printed case. Power is supplied via a 3 amp USB
power module which is plugged into the top of the unit
as shown. |
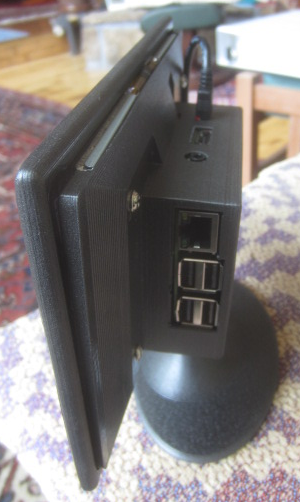 |
Most
of the Raspberry Pi's ports are accessible but the SD
card is not. |
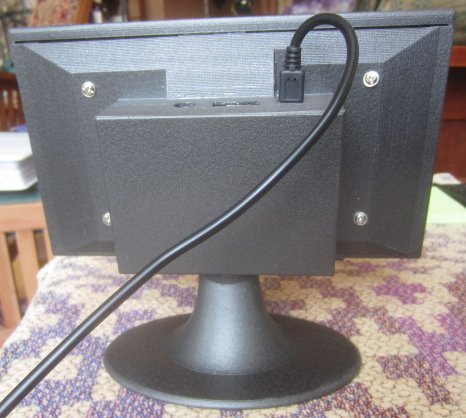 |
Back view of the finished unit. The case was printed
using PLA and then painted a metal flake black which
gives the unit a serious and professional appearance.
Unfortunately the 3D printed case doesn't quite fit the hardware completely but I thought it was good enough for my use. If I were to make another of these units I would probably purchase a commercial case with all of the kinks already worked out. |
 |
A display showing many more earthquakes.
In California, Central America, South America, the Mediterranean,
Indonesia and Hawaii. Hundreds of earthquakes can be
displayed at once. |
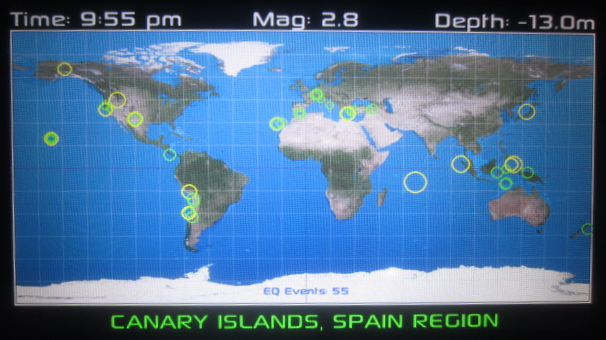 |
Another map at another time showing many
more earthquakes. The multiple earthquakes in Hawaii
and in the Canary Islands are a result of recent
volcanism. Indonesia must be rocking and rolling all
of the time as there seem to be more earthquakes in
that region than anywhere else. |
Installation
The
following are basic instructions for getting this program
to run on your Raspberry Pi with attached official 7"
touchscreen LCD . The touchscreen capability is not
currently used in this application however. You can google
for detailed hardware/software instructions for any
installation steps you are unsure of.
Connect the Raspberry Pi to the display controller module with the short flat ribbon cable.
Add the red +5volt wire and the black ground wire from the Raspberry Pi to the display controller module. Doing this makes it possible for the single USB power connection to the Raspberry Pi to power the display as well.
2. Connect a USB keyboard and USB power supply to your Pi, insert the SD card with the OS and turn the power on
3. Run "sudo raspi-config" to configure your Pi. You must configure your WiFi networks SSID and password to get networking running.
4. Once you have WiFi running, run "sudo apt-get update" and "sudo apt-get upgrade" to get the latest OS updates
5. Follow instruction from the Web for installing Python3, PyGame and FreeType
6. Create a EQMap sub directory off of your home directory (maybe /home/pi/EQMap)
7. Using scp, copy the EQMap code which consists of four Python files to this new directory.
8. Create the fonts and images sub directory beneath your EQMap directory
9. Copy the Sony.ttf font into the fonts sub directory and copy the map, eqmap800.bmp, into the images sub directory
10. To test your installation, change to the EQMap directory and run "Python3 EQMap.py". Fix any issues that show up.
11. After you are sure things are working correctly, you can make EQMap run as a service on boot. The EQMap service code is as follows:
To make EQMap run at boot time run, "sudo systemctl enable eqmap.service --now"
The EQMap program should start immediately and it should automatically restart every time your Pi is rebooted.
12. If everything checks out, you can install the hardware into the case of your choosing and begin watching the world for earthquakes.
Hardware
Mount the Raspberry Pi and the display controller to the back of the LCD with the hardware provided with the LCD displayConnect the Raspberry Pi to the display controller module with the short flat ribbon cable.
Add the red +5volt wire and the black ground wire from the Raspberry Pi to the display controller module. Doing this makes it possible for the single USB power connection to the Raspberry Pi to power the display as well.
Software
1. Using the Raspberry Pi Imager download the lite version of the Raspberry Pi OS onto an SD card (4 GBytes or larger).2. Connect a USB keyboard and USB power supply to your Pi, insert the SD card with the OS and turn the power on
3. Run "sudo raspi-config" to configure your Pi. You must configure your WiFi networks SSID and password to get networking running.
4. Once you have WiFi running, run "sudo apt-get update" and "sudo apt-get upgrade" to get the latest OS updates
5. Follow instruction from the Web for installing Python3, PyGame and FreeType
6. Create a EQMap sub directory off of your home directory (maybe /home/pi/EQMap)
7. Using scp, copy the EQMap code which consists of four Python files to this new directory.
8. Create the fonts and images sub directory beneath your EQMap directory
9. Copy the Sony.ttf font into the fonts sub directory and copy the map, eqmap800.bmp, into the images sub directory
10. To test your installation, change to the EQMap directory and run "Python3 EQMap.py". Fix any issues that show up.
11. After you are sure things are working correctly, you can make EQMap run as a service on boot. The EQMap service code is as follows:
This text should be placed in a file called, "eqmap.service" which should be copied into the "/etc/systemd/system" directory[Unit]
Description=EQMap
After=network-online.target
[Service]
Type=simple
ExecStart=/usr/bin/python /home/pi/EQMap/EQMap.py
WorkingDirectory=/home/pi/EQMap
Restart=on-abort
User=pi
[Install]
WantedBy=multi-user.target
To make EQMap run at boot time run, "sudo systemctl enable eqmap.service --now"
The EQMap program should start immediately and it should automatically restart every time your Pi is rebooted.
12. If everything checks out, you can install the hardware into the case of your choosing and begin watching the world for earthquakes.
Questions
and comments to me Craig at: calhjh@gmail.com